Hi,
today I will explain all fields available for Columns in Grid View in Project for the Web.
First of all I will crate a simple Project with some Resource assigned to Tasks:
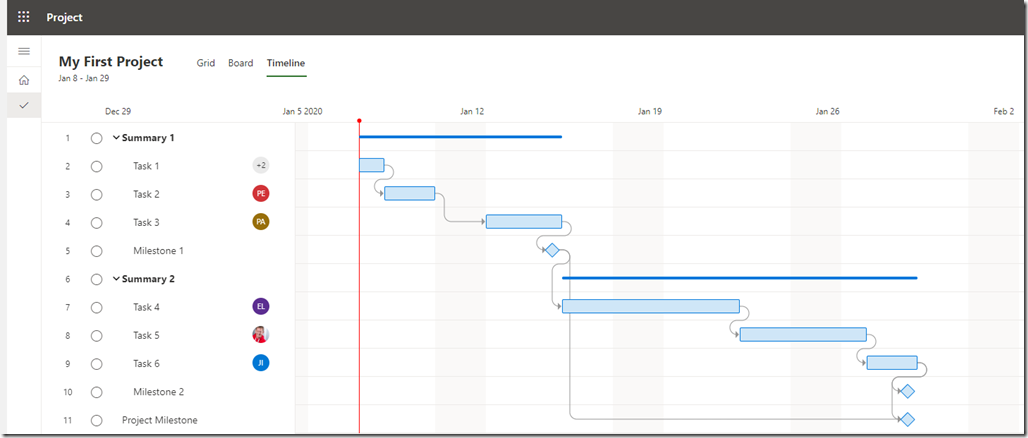
I’ve created the Schedule as well, using Timeline View:
Here I can see (visually) the Gantt Chart, and relations between Tasks.
I can adjust Columns in Grid View:
For this post I will add them all:
Now let me explain those fields one by one:
- Duration – Task duration. It can be entered or calculated according to Effort. For example, if I put effort for Task 1 = 24 hours (instead of 16), Duration will be 1,5 Days. Calculation is: 24 hours / 2 Resources = 12 hours per Resource, and 12 hours per Resource / 8 hours per day = 1,5 day!
- Assigned to – Resource(s) to whom the Task is assigned
- % complete – How much of Task is completed. I can put it, or it can be calculated by Effort completed. For example, if I put for Task 1 Effort completed = 18 hours, % completed will be 18 hours (Completed) /24 hours (Effort) = 0,75, e.g. 75%
- Depents (after) – simply – Successor(s)
- Bucket – in Which bucket is this Task (for example – Sprint 1, or Automation). If you need further explanation to Buckets, read some of my previous Blog Posts
- Depends on – simply – Predecessor
- Effort – total hours for all Resources on Task. Look in Duration above for explanation
- Effort completed – how much of effort is already done. I can enter value here (see % completed), or it can be calculated if I enter % completed
- Effort remaining – Effort – Effort completed
- Finish – Task Finish date. For example see Task 1 and Task 2:
Task 2 has Finish date – 01/10/2020. If I change it to, for example 01/13/2020 (Monday), I will move Strat date for Task 3, and the whole Schedule, as expected:
- Start – Task Start Date. It is Calculated, but If I change it, the whole Schedule will change, as well.
- Of course, you don’t have to put all those fields in Columns, just one that you really need.
Hope this helps.
Regards!


